
Compile the design.
Run it and read the transcript.
Debug the waveform and close the coverage, without leaving the window.
Simulating RTL usually means three programs. A simulator compiles and runs the design. A separate waveform viewer opens the dump afterward. A third tool reads the coverage database. Each keeps its own window, its own copy of the hierarchy, and its own idea of the current time. Every time an engineer crosses one of those boundaries, the context is rebuilt by hand: find the signal again, find the scope again, line up the cursor again.
FSiMX Studio removes the boundaries. It brings three WIOWIZ tools into one persistent session: the native FSiMX simulation engine, the FSiMX Wave waveform debugger, and Asesha. Compile, run, waveform debug, and coverage closure happen against one elaborated design, in one window, with one shared cursor. This is in-house EDA built for daily use, not a wrapper over other people's simulators. The engine, the frontend, the waveform format, and the coverage model are all ours.
We replaced Slang with our own front-end
FSiMX Studio did not start with its own front-end. The parser was Slang, the open-source SystemVerilog front-end - quick and correct on RTL. The wall came at gate level. Running GLS on a flattened, back-annotated netlist, with a UVM environment layered on top, pushed Slang past what it was built for: elaboration memory ballooned and the parse stage buckled on the sheer volume of the netlist. RTL was never the problem - the gate-level scale and the UVM class graph were.
So WIOWIZ built its own. The parser that reads your SystemVerilog, your UVM testbench and your gate-level netlist today is ours, designed for that volume from the first line. Owning the front-end is what makes everything below possible: one elaborated design that the engine, the waveform and the coverage all share.
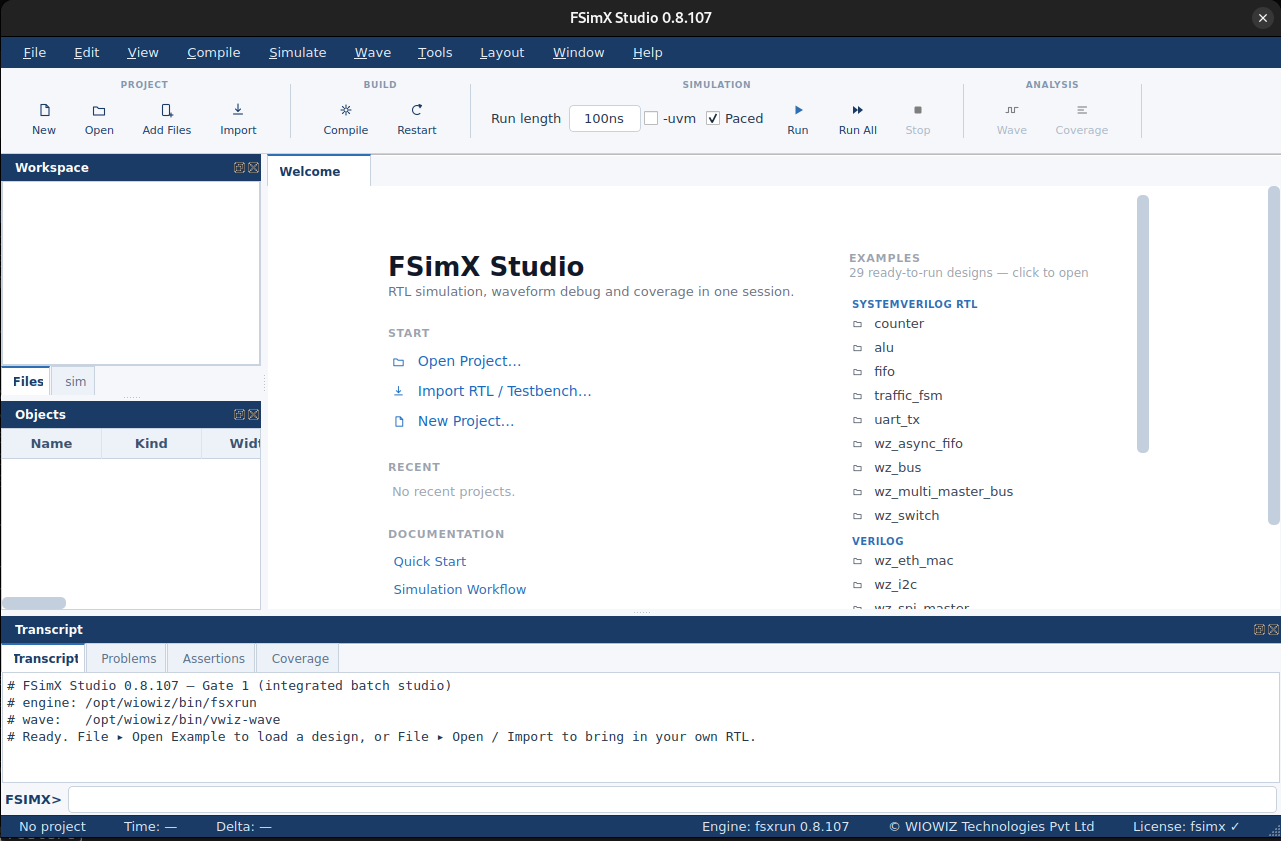
One persistent session, not three tools bolted together
The design is elaborated once. From there an engineer runs it, breaks, examines an object, and restarts without paying the elaboration cost again. Selecting a signal in the waveform selects the same object in the hierarchy and opens the source statement that drives it. The cursor is shared: move it in the waveform and the inline source values, the transaction lane, and the reconstructed memory all move with it. Nothing is re-imported between the run and the debug.
Invoke the GUI and simulate
Work is organized as a project, an .fsp file that names the sources, the top module, and the run options. The release ships 29 example projects across ten categories, from a plain counter to a low-power SoC, and each one is self-checking: it prints an explicit PASS token and returns a verdict, so an example that silently does nothing is a failure, not a pass. The simplest is a counter:
$ fsxrun counter.sv tb_counter.sv -top tb_counter

---------------- COMPILE ----------------
    2 file(s), 3 design unit(s), 0 error(s), 0 warning(s)  [0.00s]

---------------- ELABORATION ----------------
    Elaboration complete: 2 instances, 9 signals, 3 processes, 0 errors  [0.01s]

---------------- DESIGN CHECKS ----------------
    CDC:    2 domain(s), 0 crossing(s), 0 warning(s)
    Style:  0 finding(s)
    Lint:   clean
    Ports:  4 binding(s) resolved

---------------- SIMULATION ----------------
    Scheduler:  IEEE 1800-2017 event regions
    TB PASS: count=20

---------------- SUMMARY ----------------
    Simulation complete at 236 ns
    Result:     PASS
The transcript is the record of what ran: the frontend that compiled it, the elaborated shape, the structural checks, and the verdict the engine reported. The GUI does not change that verdict. If the run passes, the transcript says pass; if it fails, it shows the failing check and the time it occurred.
The example catalog
The release carries 29 example projects across ten categories. Each opens as a project, runs to a self-checked verdict, and doubles as a starting point to copy. The catalog spans a plain counter through UVM environments, a DPI reference model, power intent, an analog control oscillator, and a safety RISC-V subsystem:
| Category | Examples |
|---|---|
| Verilog | wz_spi_master, wz_i2c, wz_eth_mac |
| SystemVerilog | counter, alu, fifo, wz_async_fifo, traffic_fsm, uart_tx, wz_bus, wz_multi_master_bus, wz_switch |
| SVA | wz_apb_sva |
| UVM | wz_uvm_alu, wz_uvm_apb, wz_uvm_axil, wz_uvm_memory, wz_uvm_ral |
| DPI | wz_dpi_aes |
| SoC | wz_mini_soc, wz_soc_longrun |
| Low power | wz_clock_gating, wz_power_retention, wz_multidomain_soc, wz_real_poweraware, wz_lowpower |
| RISC-V | wz_sl1k_smoke |
| Analog | wz_ctrl_osc |
| Gate-level | wz_gls |
SystemVerilog and UVM, on the native frontend
The same engine runs class-based SystemVerilog and UVM. An ALU testbench drives randomized operands through a UVM environment, and the scoreboard compares each transaction against a reference model, printing the operation and the checked result:
$ fsxrun -f wz_uvm_alu.f -top tb_wz_uvm_alu -uvm

UVM_INFO @ 15ns: uvm_test_top [SCB] txn 1 MATCH   op=0 a=254 b=95  y=349
UVM_INFO @ 25ns: uvm_test_top [SCB] txn 2 MATCH   op=1 a=95  b=172 y=435
UVM_INFO @ 35ns: uvm_test_top [SCB] txn 3 MATCH   op=2 a=172 b=117 y=36
UVM_INFO @ 45ns: uvm_test_top [SCB] txn 4 MATCH   op=3 a=117 b=10  y=127
The frontend is one implementation that WIOWIZ owns end to end: preprocessing, parsing, elaboration, the class runtime, and foreign function calls through DPI. Verilog, SystemVerilog, UVM, and DPI go through the same pipeline rather than through separate compatibility layers.
Debug in the waveform
When a value looks wrong, FSiMX Wave opens on the same run. It traces on a subscribe-only basis so a large design stays responsive: only the signals under examination are streamed. From a suspicious value the engineer follows the structural driver to the exact source statement, reads a bus as decoded transactions in the analyzer, and reconstructs memory contents at the cursor with the write that produced each cell. Archival dumps are written as FST.
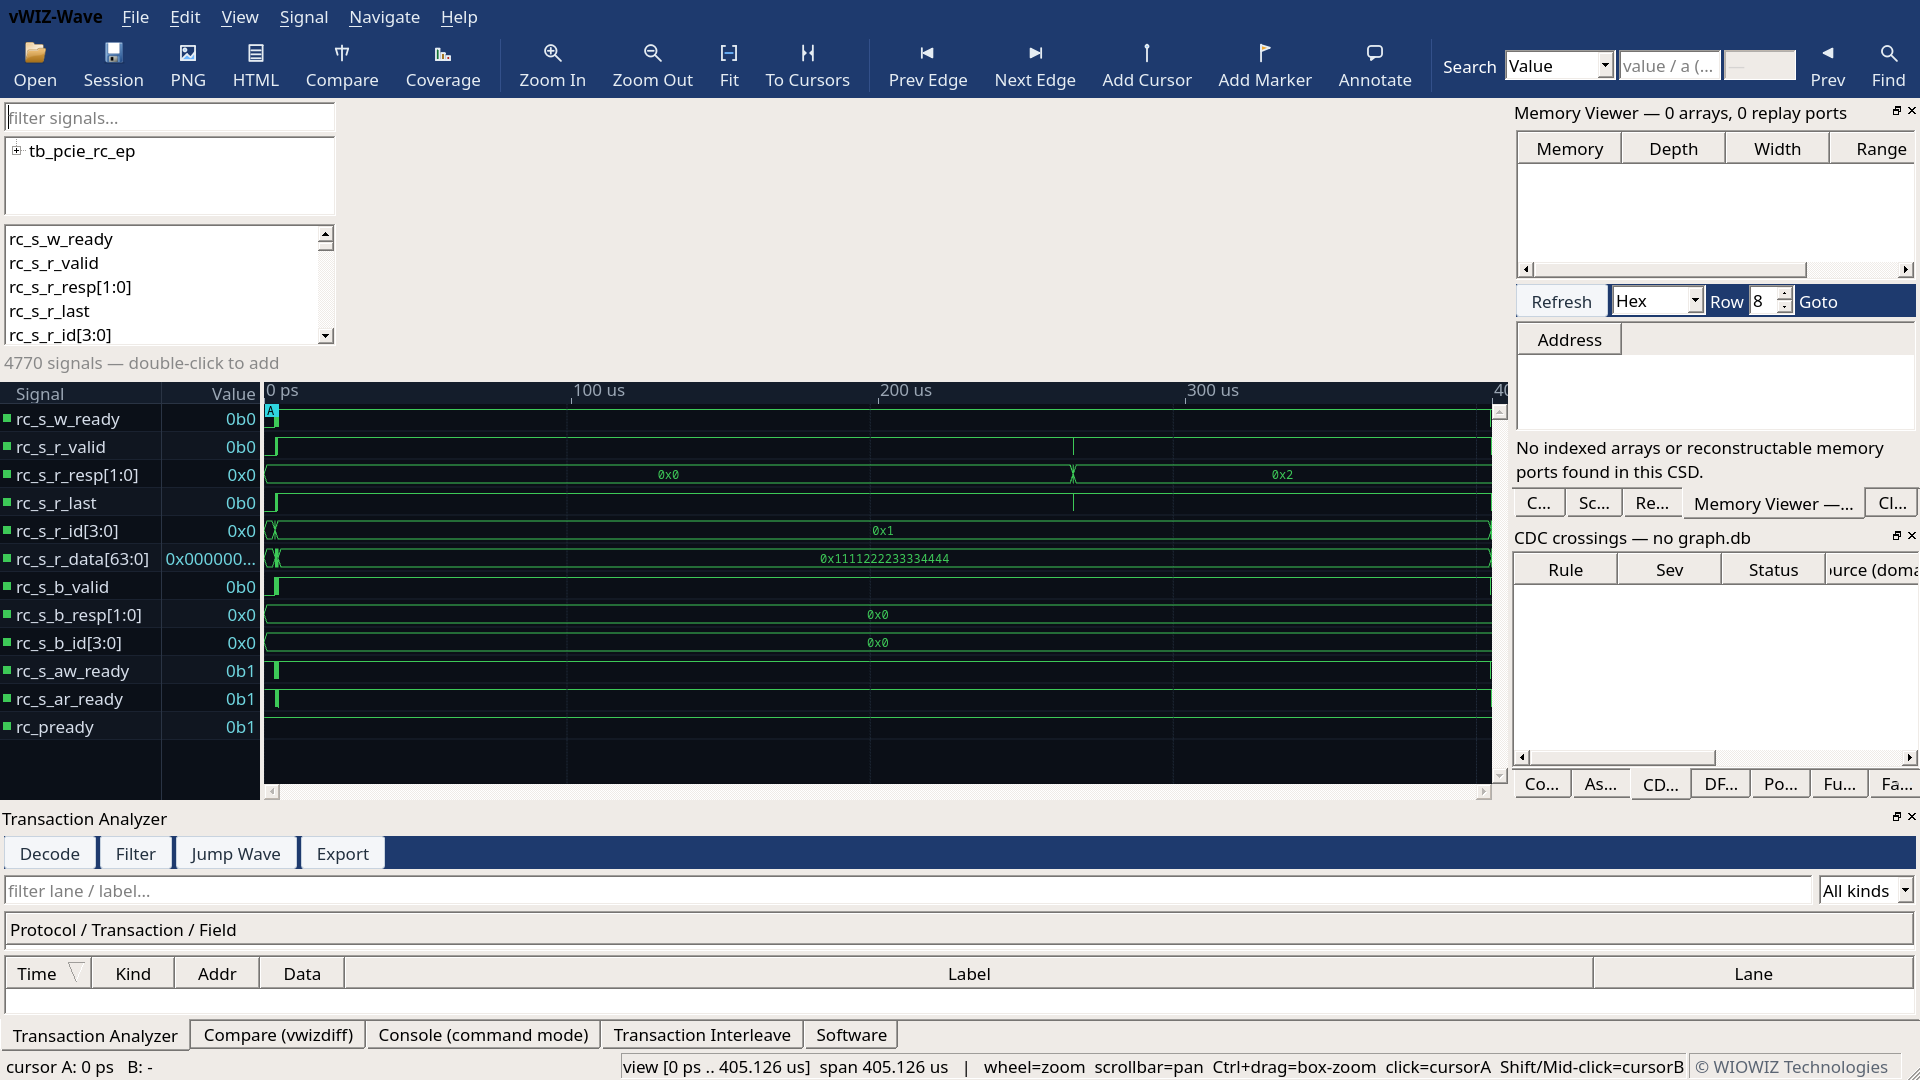
Two of these workflows have their own articles in this series: tracing a driver from the waveform to its source file, and the hardware-software co-simulation debug that lockstepped a RISC-V core against a golden reference and localized an injected bug to one forwarding path.
Close with coverage
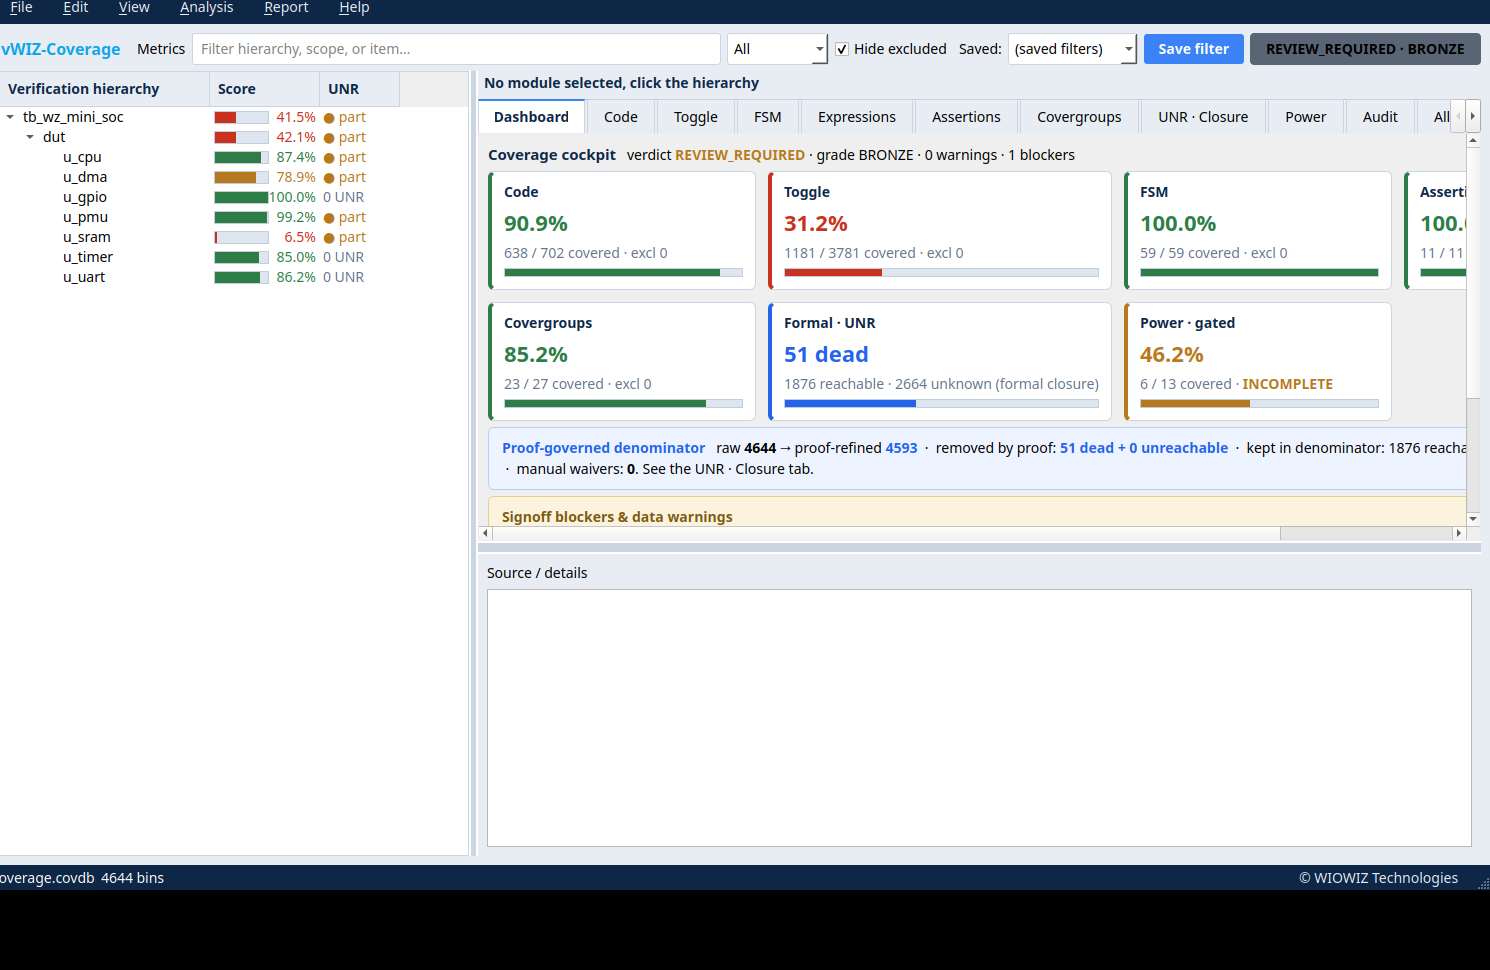
Asesha reads the same run and reports every metric family, each kept as a separate question rather than blended into one number. It states which families were collected and which were not, so an unmeasured family cannot quietly inflate an average:
# METRIC_STATUS line        COMPLETE
# METRIC_STATUS statement   COMPLETE
# METRIC_STATUS branch      COMPLETE
# METRIC_STATUS toggle      COMPLETE
# METRIC_STATUS fsm         COMPLETE
# METRIC_STATUS functional  COMPLETE
# METRIC_STATUS assertion   COMPLETE
# METRIC_STATUS expression  NOT_COLLECTED   set FSX_COV_EXPR=1
The closure dashboard adds formal unreachable analysis: code a proof shows can never execute is retired from the target by that proof, not by a manual waiver. The result is a signoff view that separates covered, uncovered, and provably unreachable.
At a glance
| Engine | Native FSiMX compiler and simulator (fsxrun), IEEE 1800-2017 event-region scheduler |
|---|---|
| Languages | Verilog, SystemVerilog, UVM, DPI on one frontend |
| Waveform | FSiMX Wave: subscribe-only tracing, source and hierarchy cross-probe, transaction analyzer, memory reconstruction, FST archival |
| Coverage | Asesha: code, toggle, FSM, expression, covergroup and assertion, plus formal UNR closure |
| Examples | 29 self-checking projects across analog, DPI, GLS, low-power, RISC-V, SoC, SV, SVA, UVM and Verilog |
| Platform | Linux x86-64, delivered as a Docker image |
| Build | v0.8.107, 2026.07 evaluation |
Run it
The evaluation build runs on Linux x86-64 as a Docker image. It carries the engine, the studio, the waveform and coverage tools, and all 35 examples.
$ docker pull wiowiz/fsimx-studio-public:2026.07-eval
$ fsimx-studio            # open the GUI on a bundled example
$ fsxrun -f examples/soc/wz_mini_soc/wz_mini_soc.f -top tb_wz_mini_soc
Compile, run, debug and close, without losing the thread.
Download FSiMX Studio
FSiMX Studio is available now. It ships as a Docker bundle from the WIOWIZ website - download it, build the image, and run the same examples, waveforms and coverage you saw in this article. The native FSiMX engine, FSiMX Wave and Asesha, in one window.
Download FSiMX Studio on wiowiz.ai →
Our Approach
We're building systems that think about specifications the way engineers do.
We build our own in-house EDA with an intelligence layer across it. Our stack covers the full flow,
from spec to comprehensive sign-off, on tools we build and control.
Walk-in ones, walk-in zeros