
Drop a signal onto a lane.
Find a value that should not be there.
Follow it back to the statement that wrote it.
A waveform viewer shows you what the design did. The work of debug is getting from a value you did not expect to the line of RTL that produced it. In FSiMX Studio the waveform is the front of that path: you drag-and-drop the signals you care about onto the lanes, move the cursor to the moment a value goes wrong, and ask the tool to trace a driver from that value back to its source statement. The example here is MiniSoC, a small system-on-chip with an AHB bus and a RISC-V core, used because it exercises a bus, a processor and structural driver tracing in one dump.
Two databases stand behind the view. The Compressed Signal Database, or CSD, holds the recorded values at every time. The RTL Graph Database, or RDB, records modules, instances, signals, source anchors and the driver and load relations between them. Driver tracing, source navigation and the schematic all query the RDB graph rather than searching signal names as text, and the CSD supplies the values at the active cursor. One time cursor is shared across the waveform, the source annotation and the schematic, so a value and the logic that produced it are read at the same instant.
Load the design and drop signals onto the waveform
Open a VCD or FST dump and the hierarchy appears as a tree of scopes. Select the signals you want and drag-and-drop them onto the waveform, or select several and drop them as a group. Lanes can be reordered, grouped and removed, so the view holds the handful of signals a given question needs rather than the whole design at once. A multi-select drop and a delete of lanes that are no longer part of the question are shown below.
Navigate with zoom, pan and the A/B cursor delta
Once the lanes are placed, the run has to be readable at two scales: the whole simulation to find the region of interest, and a few clock edges to read the values. Zoom narrows the window to the edges around an event; pan moves along the time axis without changing the zoom. The clip below zooms in on a clock until individual edges are legible.
Timing questions are answered with two cursors. Cursor A marks one event, cursor B marks another, and the readout reports the interval between them, the A/B cursor delta. That turns "how long after the request did the acknowledge arrive" into a number read directly off the axis instead of counted by eye.
Trace a driver from a suspicious value to the source statement
With the cursor on the moment a value looks wrong, the next step is to ask what set it. Select the signal and request its driver. The selected lane resolves to an object in the RDB, its driver edge leads to the source anchor that assigns it, and the CSD supplies the values present at the active cursor. The engineer moves from a suspicious value to the statement responsible for it without guessing at signal names, which is where a text search over a large design goes wrong.
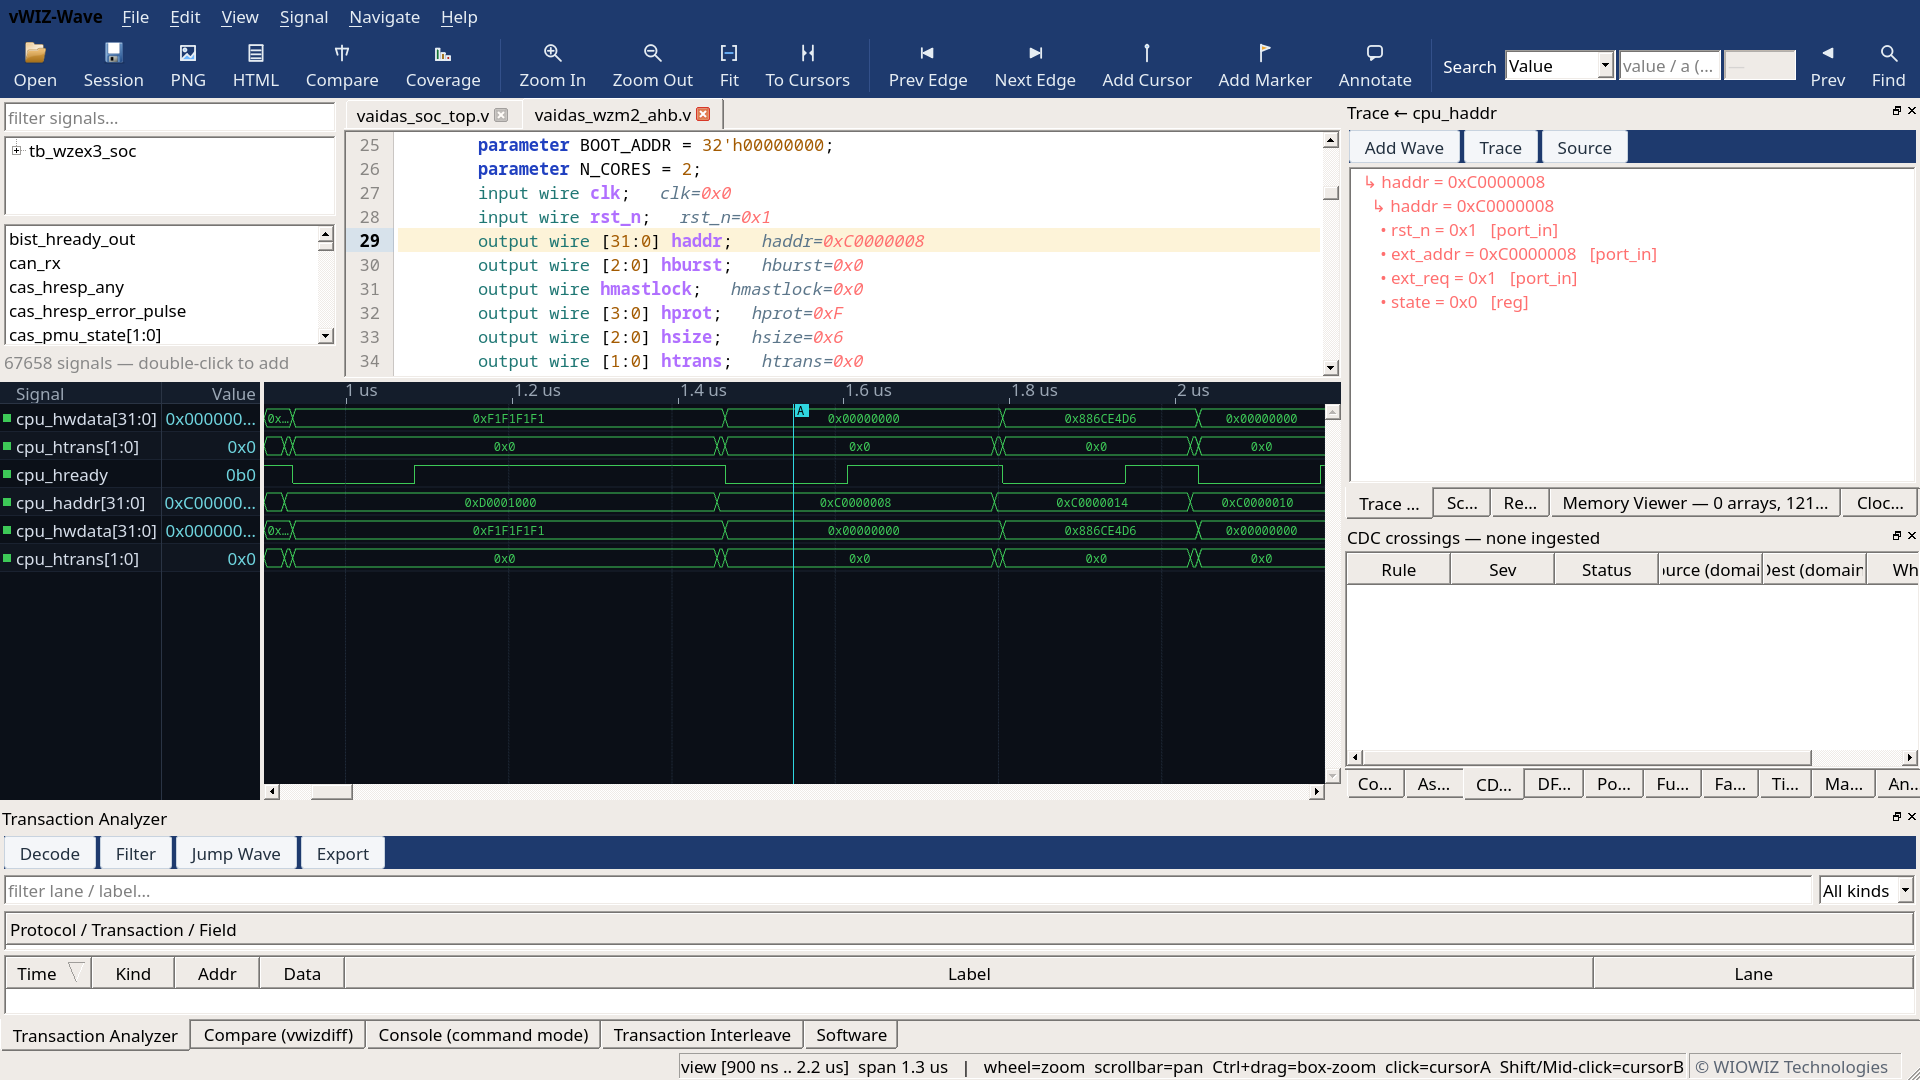
The trace does not stop at the combinational assignment. Registered logic needs a temporal step: the trace identifies the capturing clock, moves to the preceding active edge where the data and enable were sampled, and reports the values that were present before that capture edge, which is where a wrong result is usually born. From there it can continue into the previous combinational cone. Each step is inspectable rather than a single verdict, so a path that does not fit the design intent can be rejected and the trace continued elsewhere.
Read the source with inline values and the schematic instance
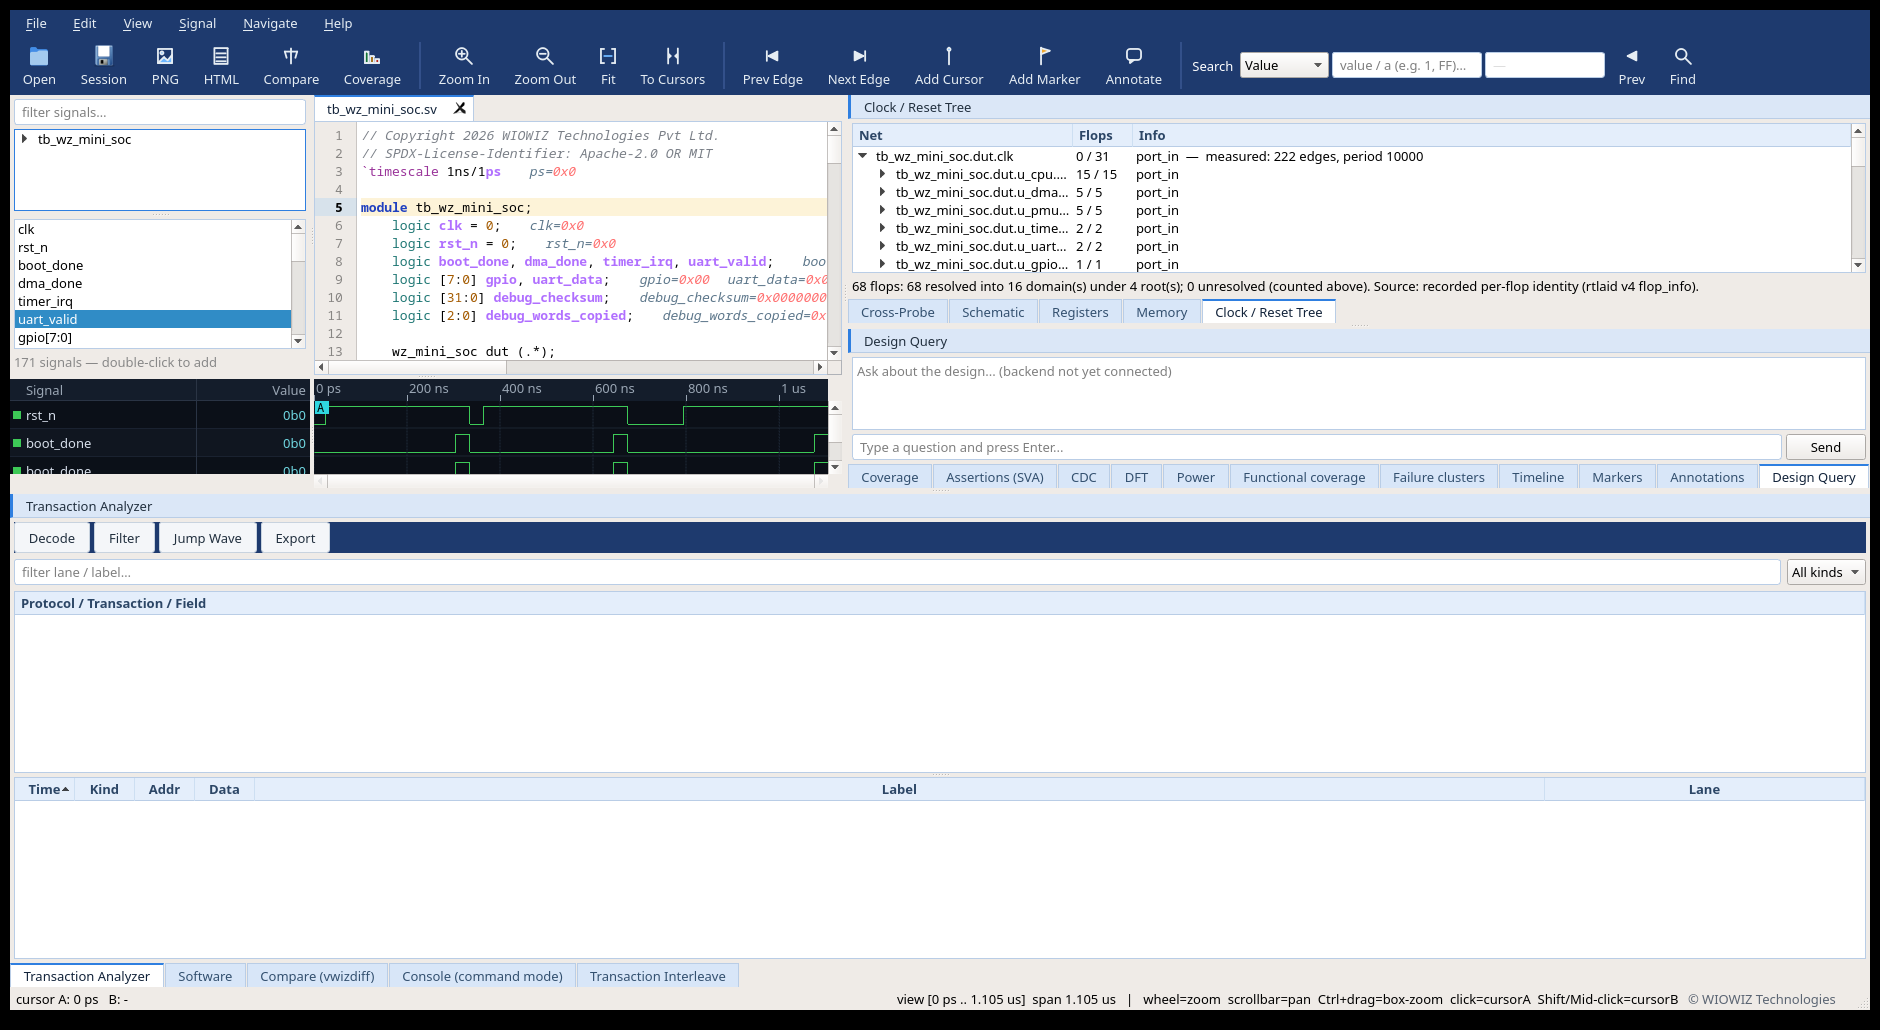
Opening the source anchor lands on the exact statement, and the source view places the value at the active time directly on the code, so the reader sees both the statement and what it evaluated to. That is the difference between reading logic in the abstract and reading it at the cycle that failed. The capture below is AHB bus traffic shown beside its RTL with inline values on the statements.
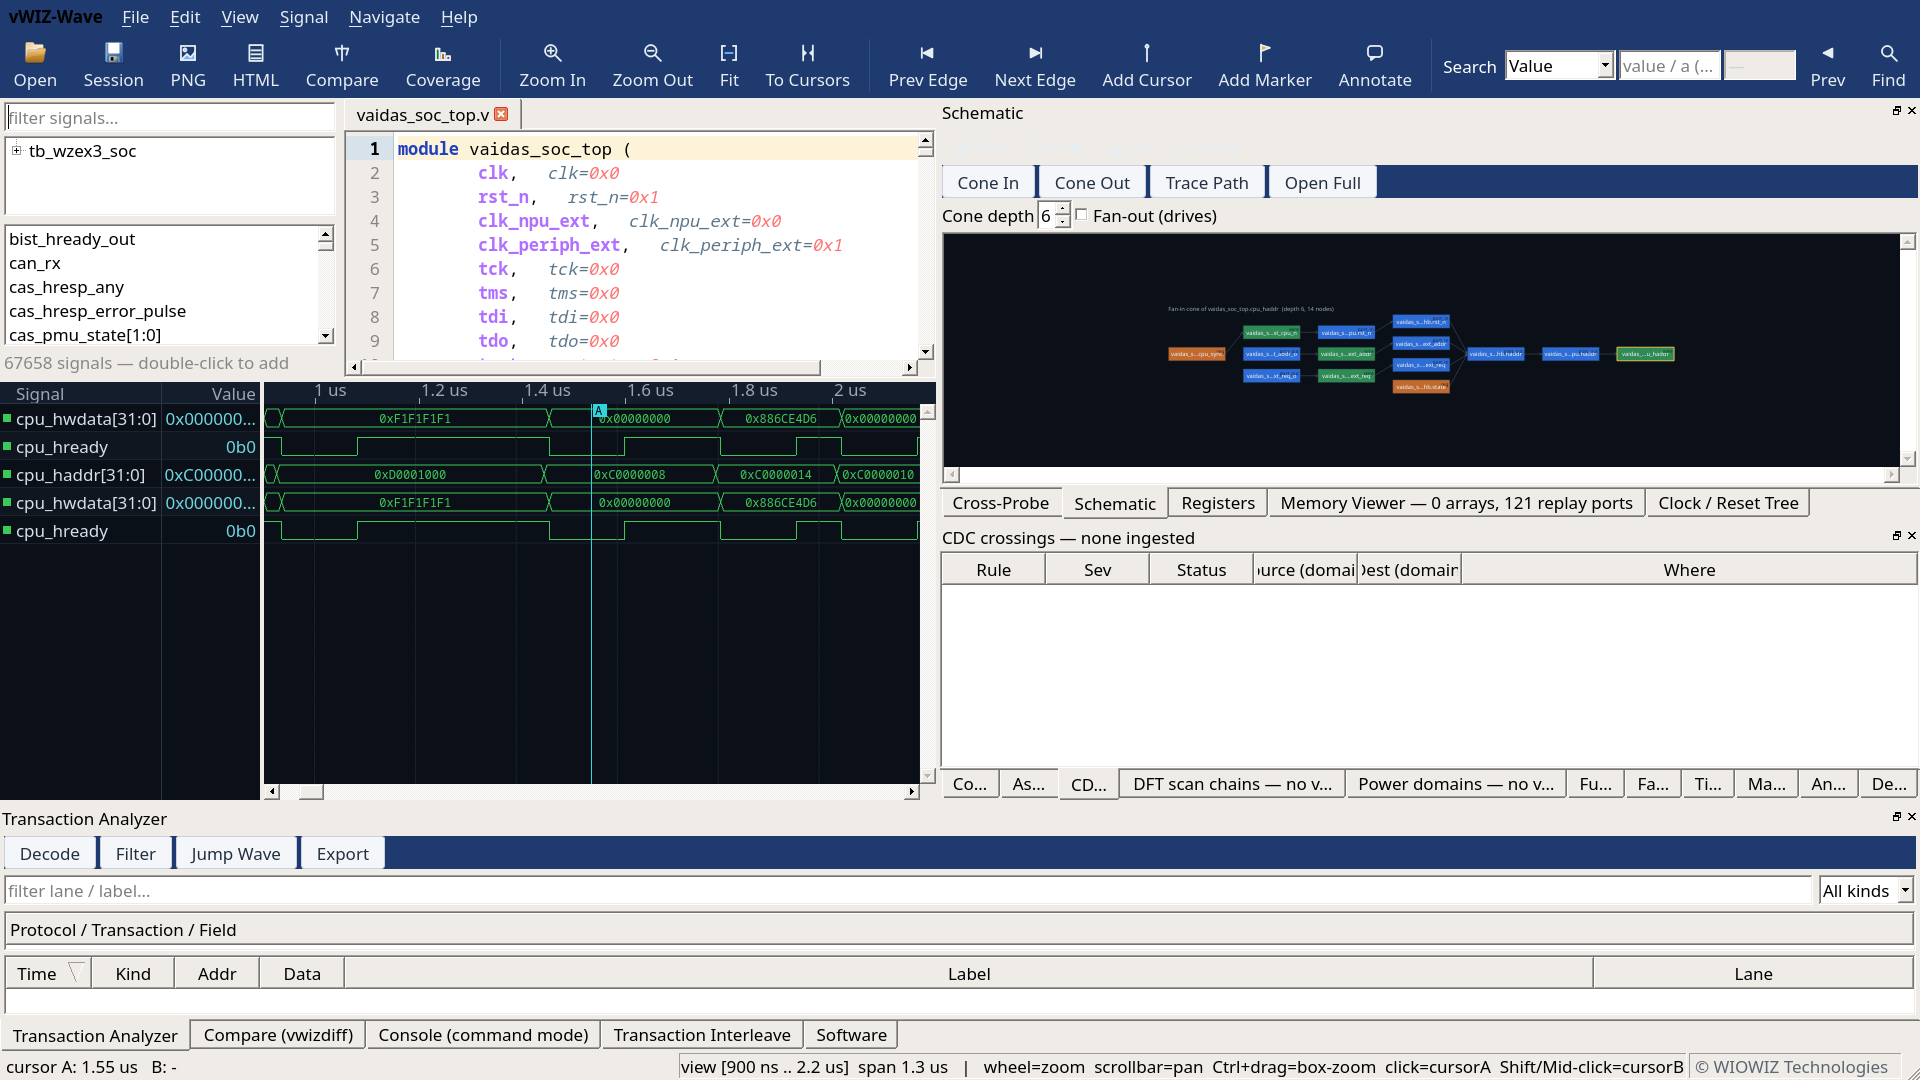
The schematic view adds the surrounding instance structure at the same instant. A statement rarely explains a wrong value on its own; the inputs that fed it, and the instance it sits inside, are the context that does. Because the schematic reads the same cursor, the values shown on its pins are the values at the moment under investigation rather than a static netlist drawing.
Follow the program counter and cross-probe each address
On a processor design the same mechanism follows the RISC-V program counter across the run. Each fetched address on the trace cross-probes back to the waveform interval that produced it and to the source, so a long instruction trace becomes a path you can step through in both directions rather than a flat list. Pick an address in the trace and the waveform lands on the cycle that fetched it; pick a cycle on the waveform and the trace names the instruction retired there.
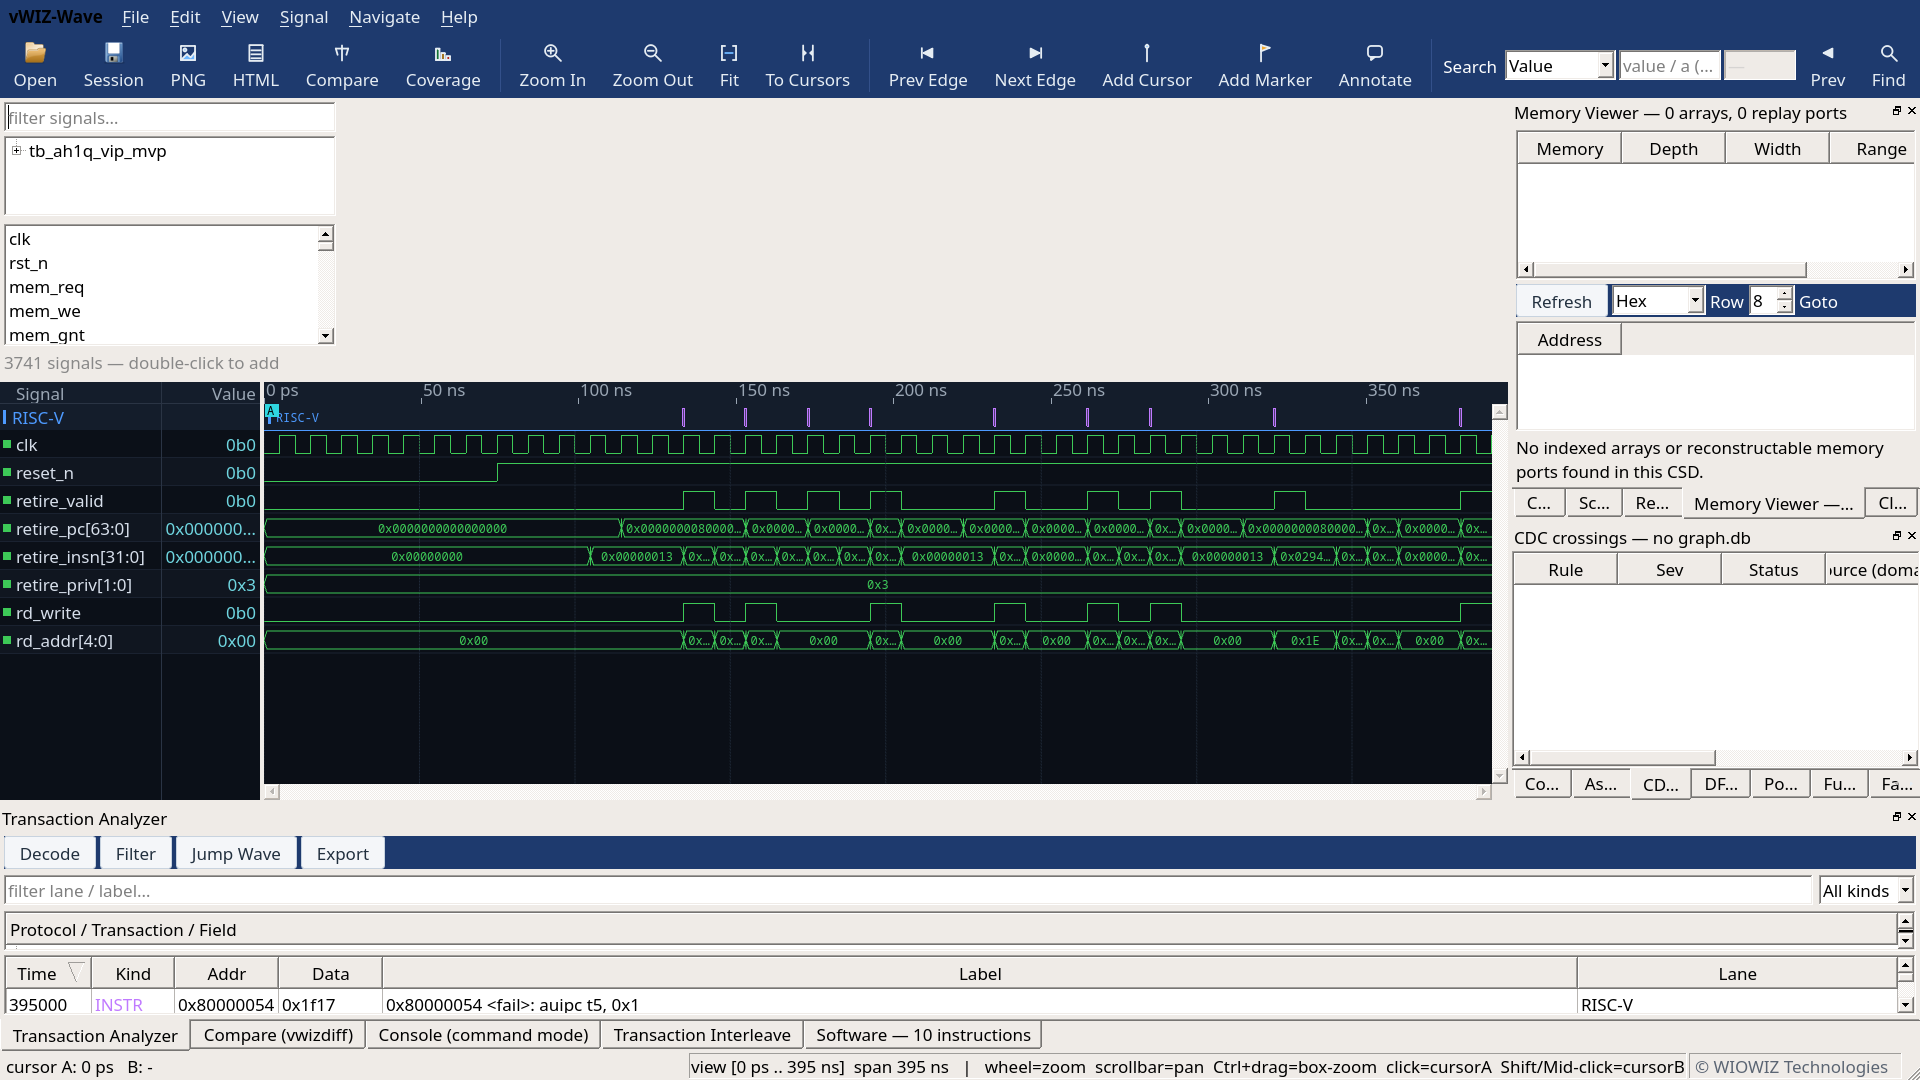
That link is what makes a processor dump navigable. A branch to an address you did not expect is a value like any other, and the driver trace works on the fetch path the same way it works on an AHB signal: from the address on the lane, to the logic that drove the next program counter, to the statement that computed it. The waveform is where the question starts, and the source anchor is where it ends.
The source statement that wrote it is the answer, and the waveform is the path between them.
Download FSiMX Studio
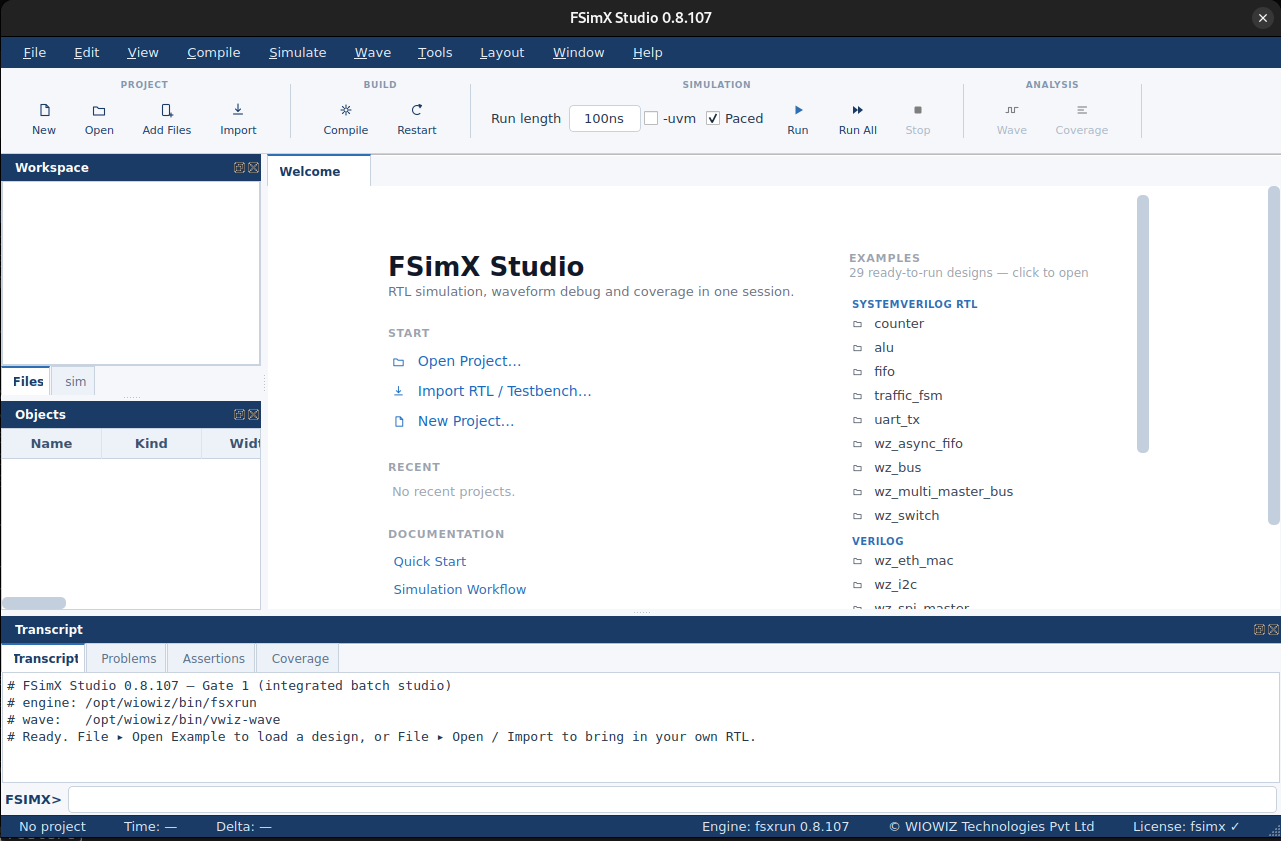
FSiMX Studio is available now. It ships as a Docker bundle from the WIOWIZ website - download it, build the image, and run the same examples, waveforms and coverage you saw in this article. The native FSiMX engine, FSiMX Wave and Asesha, in one window.
Download FSiMX Studio on wiowiz.ai →
Our Approach
We're building systems that think about specifications the way engineers do.
We build our own in-house EDA with an intelligence layer across it. Our stack covers the full flow,
from spec to comprehensive sign-off, on tools we build and control.
Walk-in ones, walk-in zeros