
A waveform tells you which wires toggled.
A transaction tells you which operation ran.
A memory cell tells you which write put that value there.
Raw signals are the ground truth, and they are also the slowest way to answer most questions. On a link that carries a request and its completion many cycles apart, interleaved with other traffic, reading the operation off the wires by hand is the work you want the tool to do. The transaction viewer decodes that operation and keeps it pinned to the exact interval it came from. The memory viewer does the same for storage: it reconstructs the contents at the cursor and holds a link from each cell back to the write that produced it. Neither view invents state. Each one reads what the run recorded and presents it where the engineer is already looking.
A transaction aligned to the interval it was decoded from
The transaction analyzer groups signal activity into an operation with a start time, an end time, a direction, an address, payload fields and a completion status. The capture below is a Peripheral Component Interconnect Express Root Complex to Endpoint run opened in Wave, with a decoded protocol transaction shown in the analyzer beside the transaction lane. The run carries 4,770 signals.
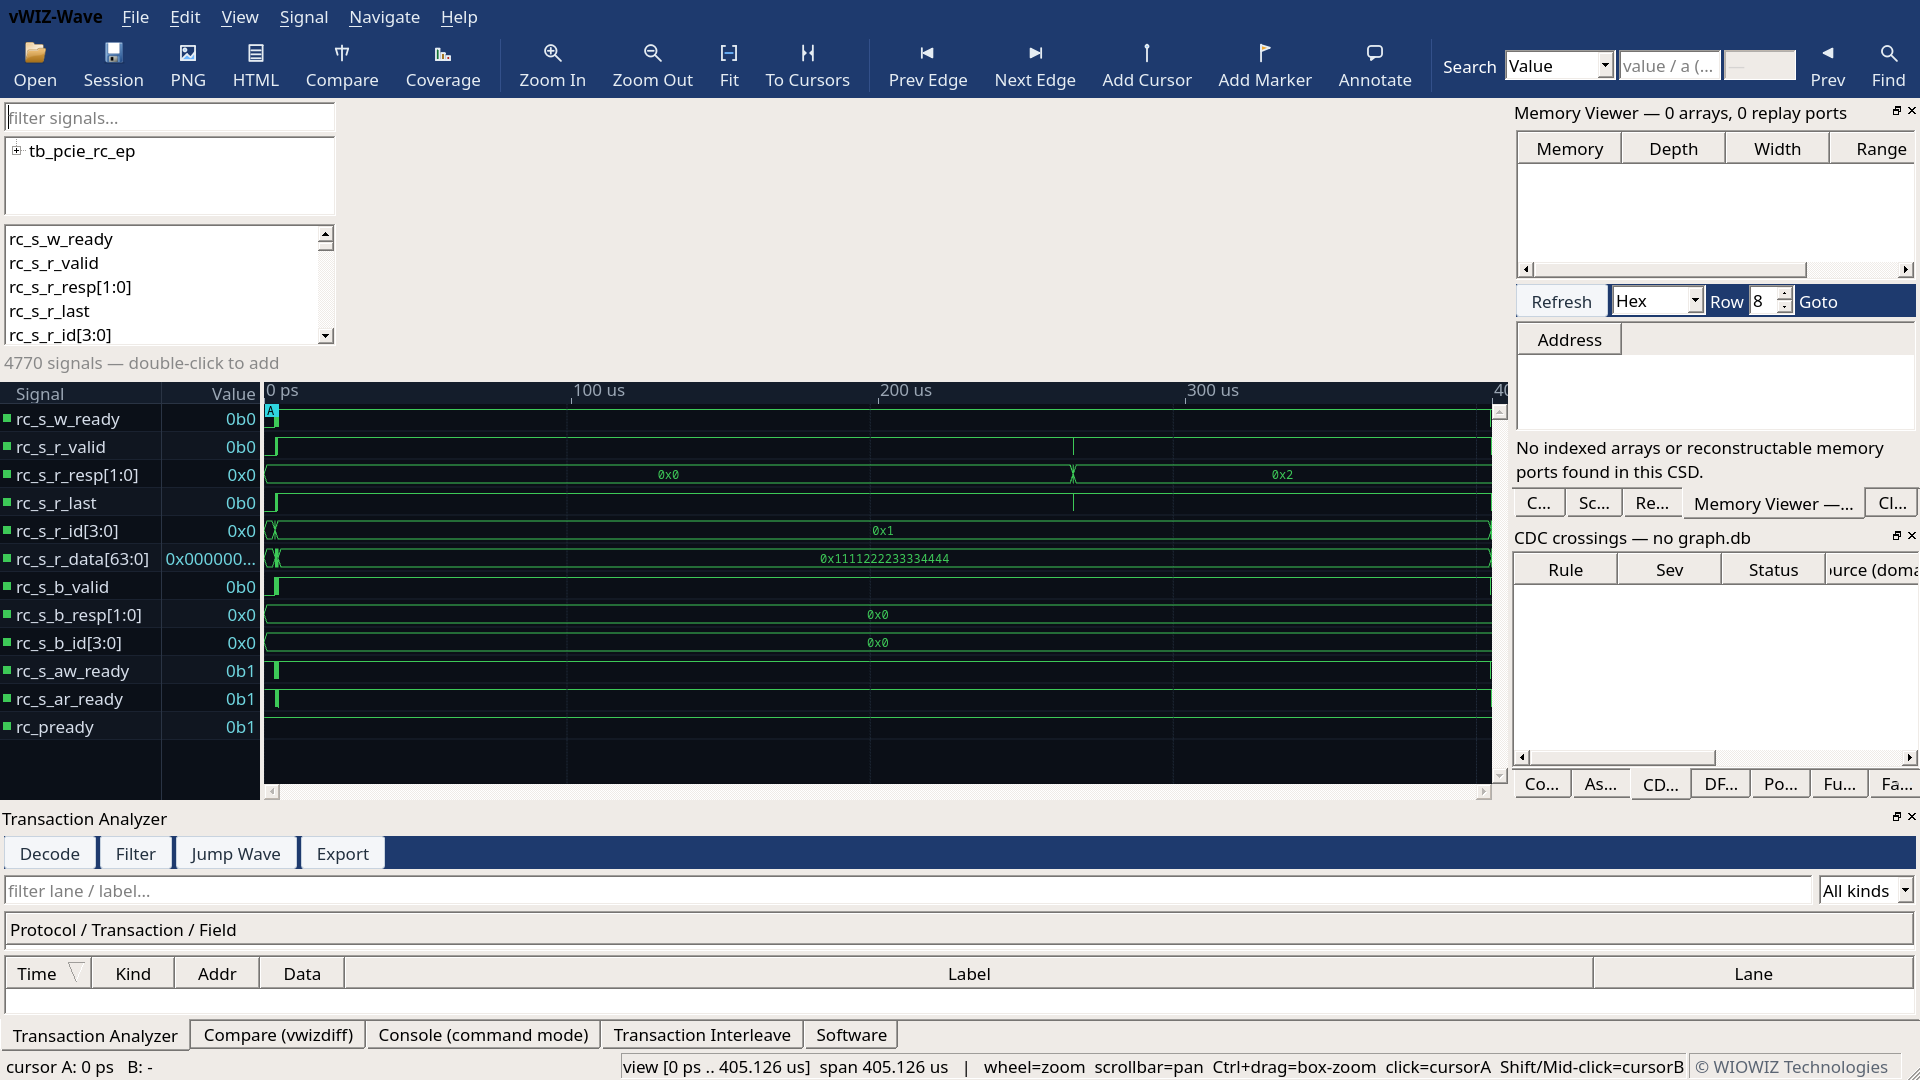
Selecting a row moves the waveform to the interval the row was decoded from. The fields used to match a completion back to its request stay on the record, so a response can be followed to the request that issued it and both intervals can be inspected without deleting the surrounding raw evidence. That matching is what makes a pipelined link readable: requests and responses may be separated by other traffic, and more than one identifier may be outstanding at once.
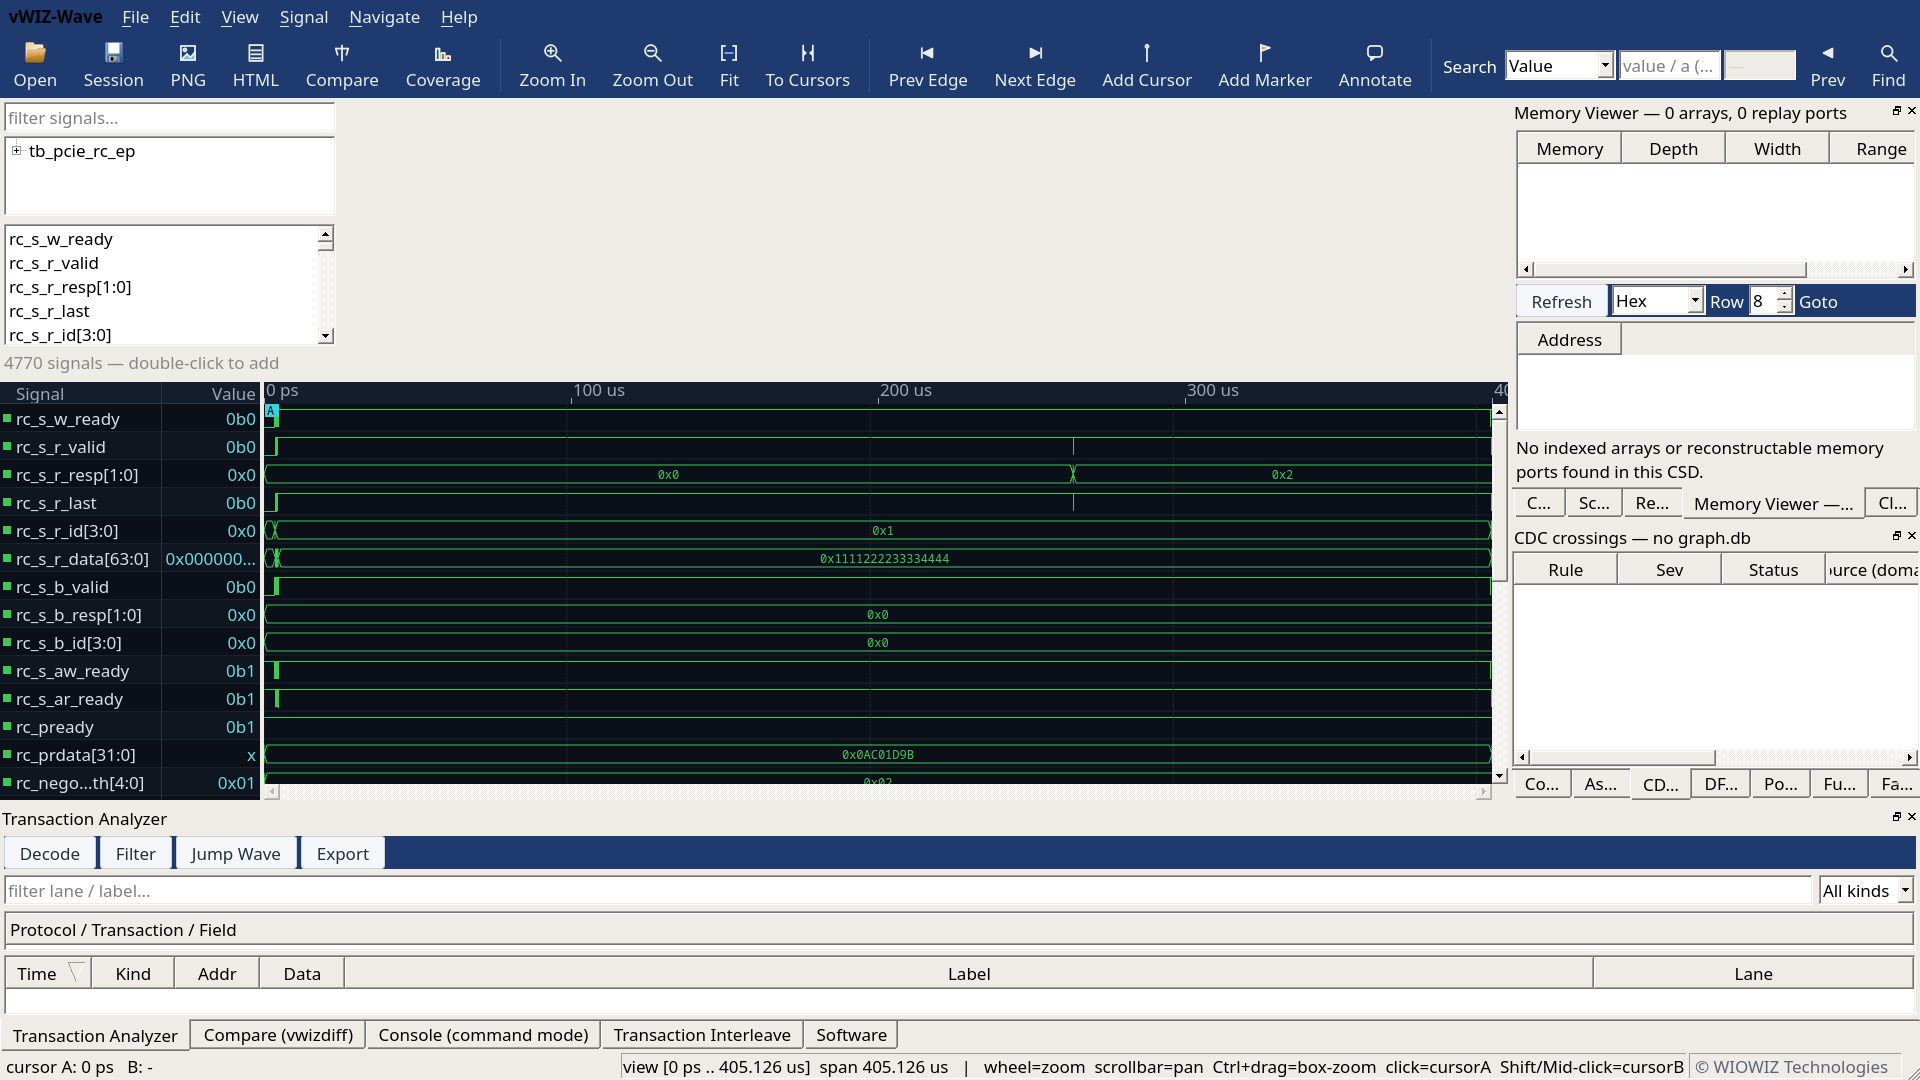
The same run at full range shows the scale behind the analyzer. All 4,770 signals are present, and the cursor and the transaction lane stay aligned as the window moves across the capture.
The same transaction model applies to the serial buses. An i2c transfer and a spi transfer each decode to a row with its own address, direction and payload, aligned to the byte-by-byte activity on the wires. A uart frame decodes the same way. In every case the row is a summary of an interval, not a replacement for it, and the interval is one click away.
Scoped instance identity in a large hierarchy
A transaction is only useful if it is attributed to the right block. In a design with several instances of the same interface, an address and a direction do not identify which one produced the operation. The analyzer resolves each transaction to a scoped instance in the hierarchy, so a row ties to the specific instance that carried it rather than to a signal name that repeats across the tree.
This matters because signal names are not unique and scopes are. A retirement probe or a bus interface is a coherent group of signals in one scope, not a busiest single candidate scattered across unrelated modules. Binding on the scope keeps the transaction, the waveform lane and the source instance pointing at the same place, which is what lets an engineer cross-probe from a transaction to the instance, the raw signals and the RTL that drives them.
Memory reconstruction with write provenance
The memory viewer answers a different question: what is stored, and how did it get there. The RTL graph supplies the declared memory shape and its location in the hierarchy. The recorded signals supply the observed address, write data, write enable and clock activity. Together they support memory reconstruction at the active time cursor, where each cell value is the result of replaying the observed writes up to that instant.
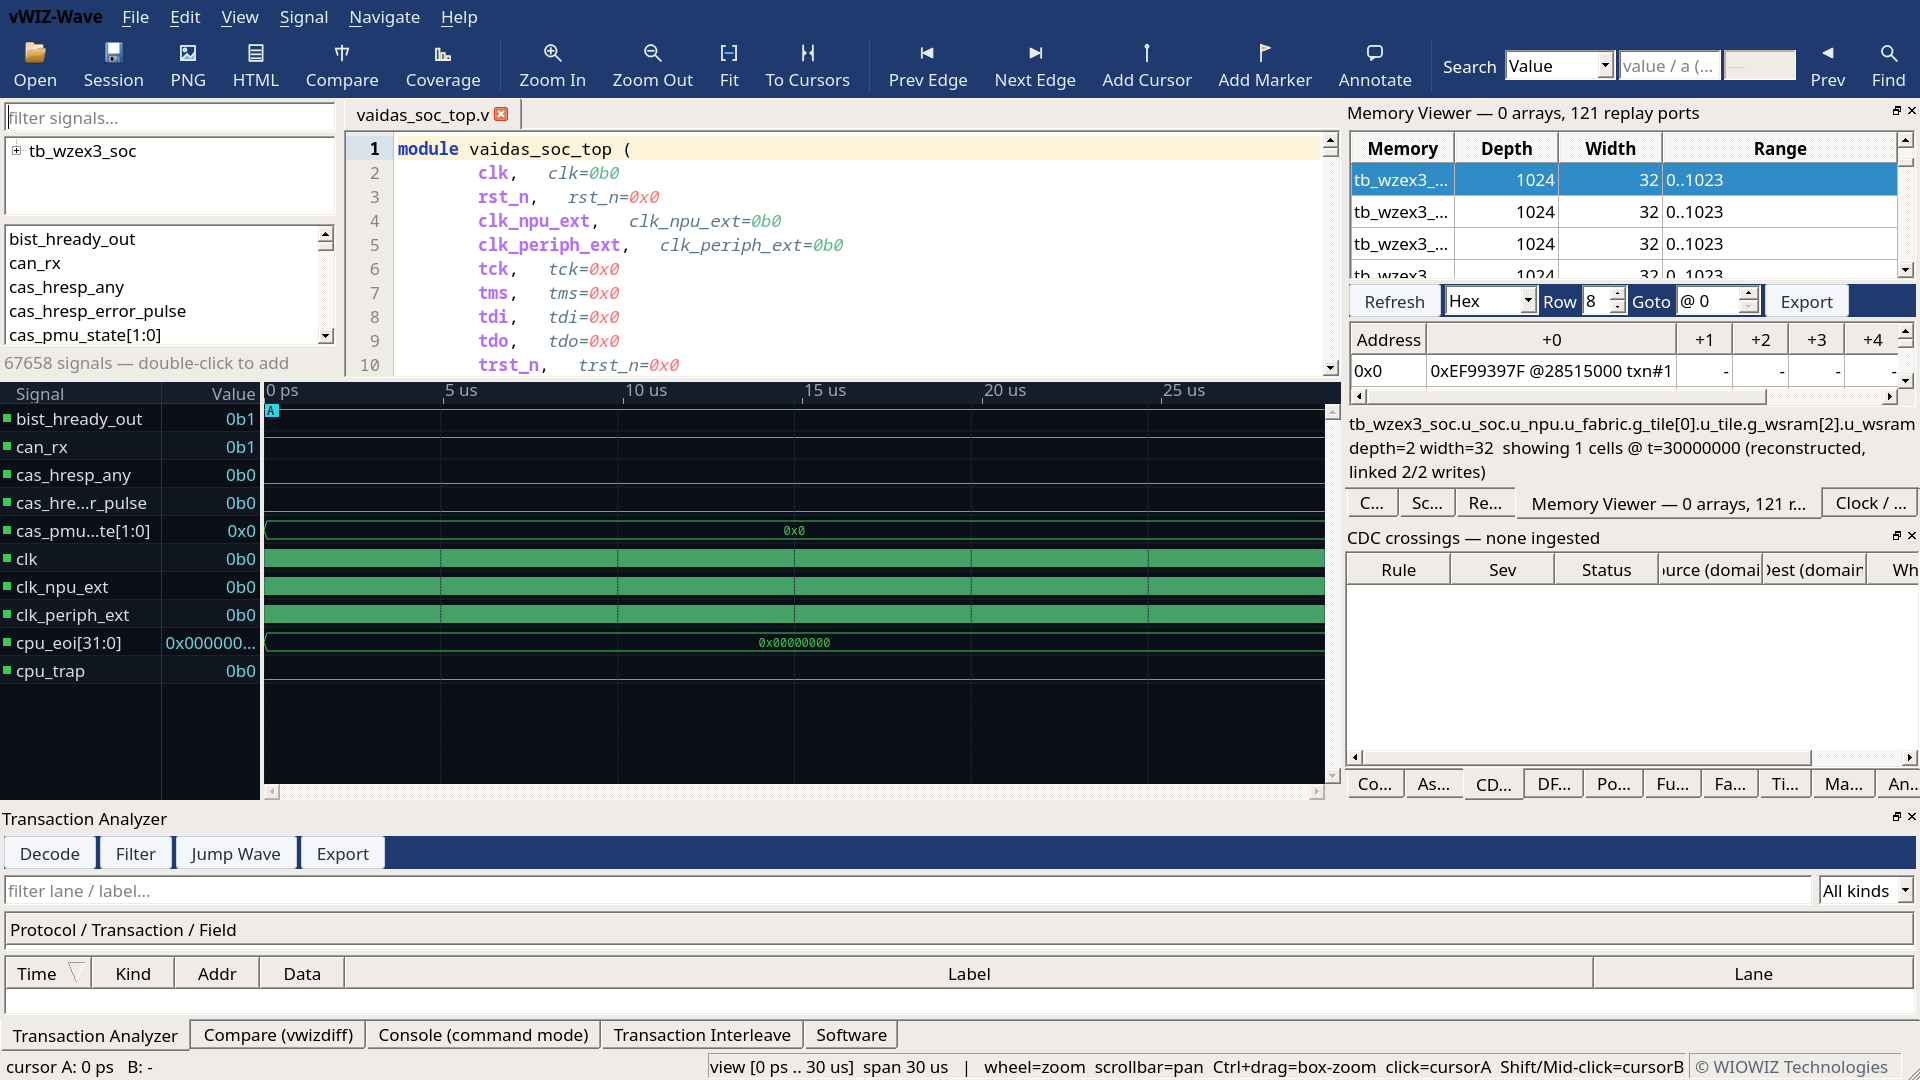
Each cell keeps its write provenance: a selected cell links to the write event that set it and, where a transaction is present, to the transaction record that carried that write. Navigation runs the other way too. Clicking a cell returns to the time interval and the transaction used to reconstruct it, rather than leaving the engineer to search by address. Reset values are shown when the RTL graph carries them, so a cell still at its reset value is distinguishable from a cell that was written back to the same value. The reconstruction is built from observed interfaces and known reset information; it is not presented as an internal simulator checkpoint.
Why the two viewers shorten a debug
The two viewers earn their place when the symptom appears far from its cause. A processor may read corrupted firmware many cycles after a transfer stored it, and by the time the read fails the write is long off-screen. Chasing that on raw signals means scrolling backward through thousands of transitions with an address in one hand and a guess in the other.
The path through the viewers is shorter. The failing read lands on a memory cell. The cell's write provenance names the write that set it and the interval it happened in. The transaction record identifies the operation that carried the write, and the scoped instance identity says which block issued it. From a wrong value the engineer moves to the write, to the transaction, to the instance, and to the raw interval that confirms the handshake, in that order, without reconstructing any of it from memory.
Both viewers are worth exactly what they inspect. A transaction lane shows only the protocols with a decoder present, and a reconstructed memory shows only the writes the run recorded. Where a decoder is not present the row is absent rather than guessed, and where reset evidence is missing the cell says so. That restraint is what keeps the viewers pointing at the run instead of at a plausible story about it.
The transaction and memory viewers say what it meant, and where it came from.
Download FSiMX Studio
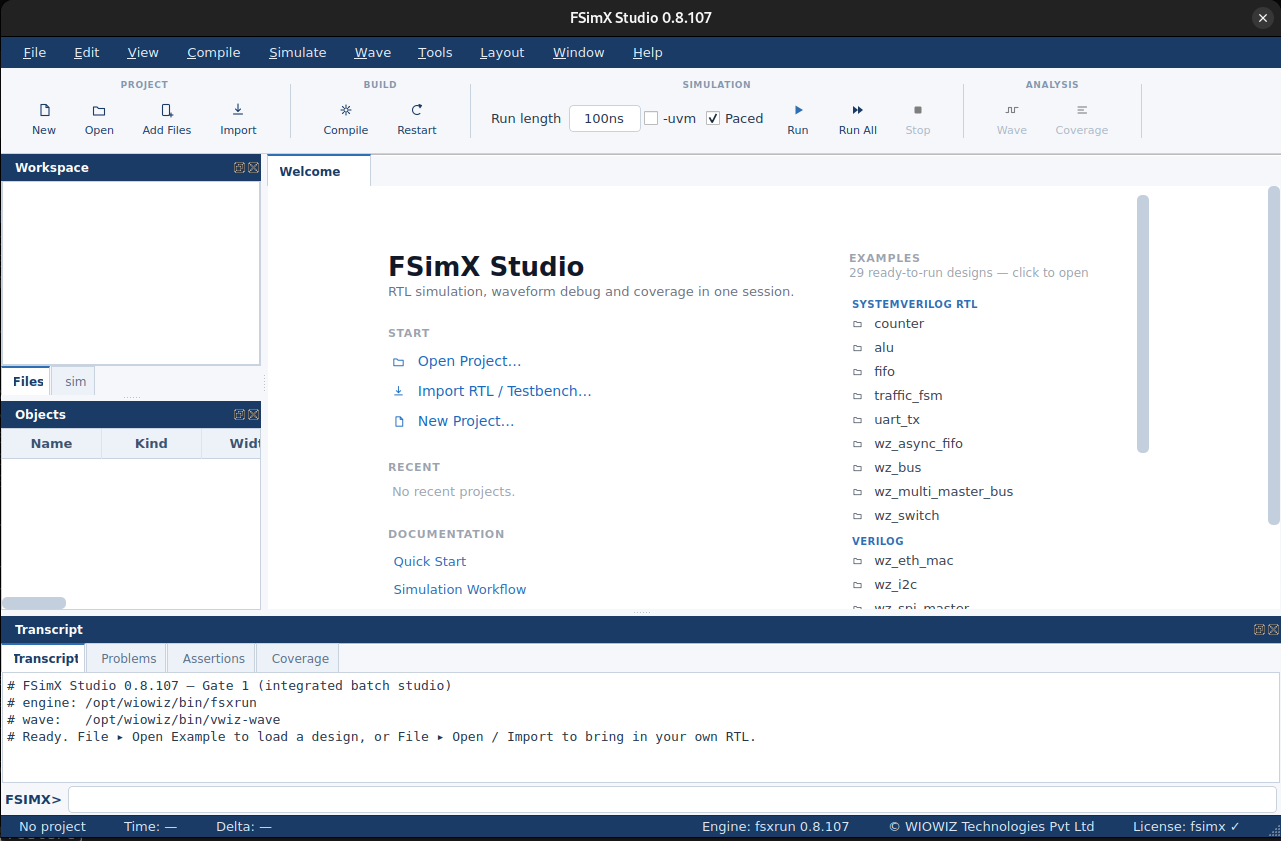
FSiMX Studio is available now. It ships as a Docker bundle from the WIOWIZ website - download it, build the image, and run the same examples, waveforms and coverage you saw in this article. The native FSiMX engine, FSiMX Wave and Asesha, in one window.
Download FSiMX Studio on wiowiz.ai →
Our Approach
We're building systems that think about specifications the way engineers do.
We build our own in-house EDA with an intelligence layer across it. Our stack covers the full flow,
from spec to comprehensive sign-off, on tools we build and control.
Walk-in ones, walk-in zeros